By CAC2 Member Bob Piniewski, People Against Childhood Cancer
Childhood cancer statistics, like all statistics (1), can be confusing. Any statistic can be used to hide or distort the truth, and even the statistics we trust may only tell part of the story. This essay analyzes some familiar childhood cancer statistics and attempts to draw them together in a holistic way to estimate the projected lifelong outcomes for a child diagnosed with childhood cancer in the United States today. By lifelong outcomes, we mean what may happen over that child’s entire life–not just today or in five years, but 10, 20 or 30 years from now (which is about as far as the data will let us project). Why do this? Children have their whole lives ahead of them, so life-long outcomes carry more weight and meaning than the commonly tracked and quoted “80-85% survival rate” that identifies that proportion of children still alive five years after their initial diagnosis. Children who die as a result of their cancer beyond this 5-year milestone, those who develop secondary instances of cancer, and those who experience chronic life-threatening health conditions caused by their cancer treatments are NOT accounted for in a five-year survival rate statistic. The five-year survival rate is not enough because, we all want to plan for our child’s future. College. Marriage. Having kids of their own. We want our children to live and prosper for more than five years! No one is satisfied when a child diagnosed at age two lives just past age seven! Our goal can ONLY be that any child diagnosed with cancer lives a normal lifespan not struck short by premature death from being “cured” or hampered by the burden of chronic health conditions. What are the potential outcomes? Using verified evidence, this essay walks through an approach to estimating the likelihood of six life-long outcomes for a child diagnosed with cancer:
Outcome #1 A child lives at least 30 years after diagnosis without health conditions
Outcome #2 A child lives at least 30 years, but faces slight to moderate chronic health conditions
Outcome #3 A child lives at least 30 years, but faces moderate to severe chronic health conditions
Outcome #4 A child lives at least 30 years, but faces life-threatening or disabling chronic health conditions
Outcome #5 A child dies within 30 years of diagnosis
Outcome #6 A child dies within five years of diagnosis
Data Set for Evaluating Childhood Cancer – Current Outcomes This section will identify the key statistics used in the analysis and the source of the statistics. These statistics change over time and do not represent any specific cancer type or outcome. The statistics are from trusted, verifiable sources, including the National Cancer Institute-funded Childhood Cancer Survivor Study, the American Cancer Society, and the National Cancer Institute. Key statistics are:
- The average 5-year survival rate for childhood cancers when considered as a whole is 84%. (2).
- Among those children who survive to five years from diagnosis, 18% of them will die over the next 25 years. (3)
- More than 95% of childhood cancer survivors will have a significant health related issue by the time they are 45 years of age (4); these health related issues are side-effects of either the cancer or more commonly, the result of its treatment. These issues include:
- 33% will suffer severe and chronic side effects;
- 33% will suffer moderate to severe health problems; and,
- 33% will suffer slight to moderate side effects. (4)
The first data set, for the 84% 5-year survival rate, is directly from the American Cancer Society, Cancer Statistics, 2020. It only reflects an average and in no way represents a single anticipated actual survival outcome for any individual child or cancer type. The data is based on outcomes for various types of childhood cancers for data through 2017. The second data set comes from a 2008 paper Cause-Specific Late Mortality Among 5-Year Survivors of Childhood Cancerwritten as part of the Childhood Cancer Survivor Study (CCSS). The CCSS is the largest, nationwide project to track and evaluate the outcomes for childhood cancer survivors. About the CCSS: “The CCSS is a component of the Long Term Follow Up Study, began in 1994 and is a collaborative, multi-institutional study funded by a grant from the National Cancer Institute of the National Institutes of Health and funds from ALSAC, St. Jude fundraising organization. The CCSS is composed of individuals who survived five or more years after diagnosis for cancer, leukemia, tumor, or similar illness diagnosed during childhood or adolescence. The CCSS, which includes all participants in the Long Term Follow Up Study with a confirmed diagnosis of cancer, is a retrospectively ascertained cohort of 35,923 childhood cancer survivors diagnosed between 1970 and 1999. It also includes over 5,000 siblings of survivors who serve as the comparison group for the study.” The third data set is from Clinical Ascertainment of Health Outcomes Among Adults Treated for Childhood Cancer by Melissa M. Hudson, MD; Kirsten K. Ness, PT, PhD; James G. Gurney, PhD in 2013. Participants in this study were also considered part of the CCSS. According to the article, more than 95% of childhood cancer survivors will have a significant health related issue by the time they are 45 years of age; these health related issues are side-effects of either the cancer or more commonly, the result of its treatment. In general, 1/3 will suffer severe and chronic side effects; 1/3 will suffer moderate to severe health problems; and 1/3 will suffer slight to moderate side effects.” Survivors reported chronic health conditions including: vision, hearing and/or speech problems, infertility, psycho-social issues, cardiovascular, pulmonary, gastrointestinal, renal, musculoskeletal, neurological, and/or endocrine conditions, and/or secondary cancers. Calculation of Childhood Cancer – Current Outcomes This data is then used to calculate the potential, long-term outcomes on a percentage basis. Integrating the analysis produces the following summary table of projected outcomes.
|
Childhood Cancer – Projected Outcomes |
# |
% |
|
100 children are diagnosed with cancer |
100 |
100% |
|
16% die within 5 years of diagnosis |
16 |
16% |
|
18% of the 84 Five-Year Survivors die within 30 years of diagnosis (84 x 0.18 = 15) |
15 |
15% |
|
95% of survivors live 30 years, but 1/3 experience suffer slight to moderate health conditions (100-16-15) x 0.95 x 0.33 |
22 |
22% |
|
95% of survivors live 30 years, but 1/3 experience moderate to severe chronic health conditions (100-16-15) x 0.95 x 0.33 |
22 |
22% |
|
95% of survivors live 30 years, but 1/3 experience severe, life threatening or disabling health conditions (100-16-15) x 0.95 x 0.33 |
22 |
22% |
|
Child survives at least 30 years with good health (100-16-15-22-22-22) |
3 |
3% |
|
Total |
100 |
100% |
Childhood Cancer – Current Outcomes
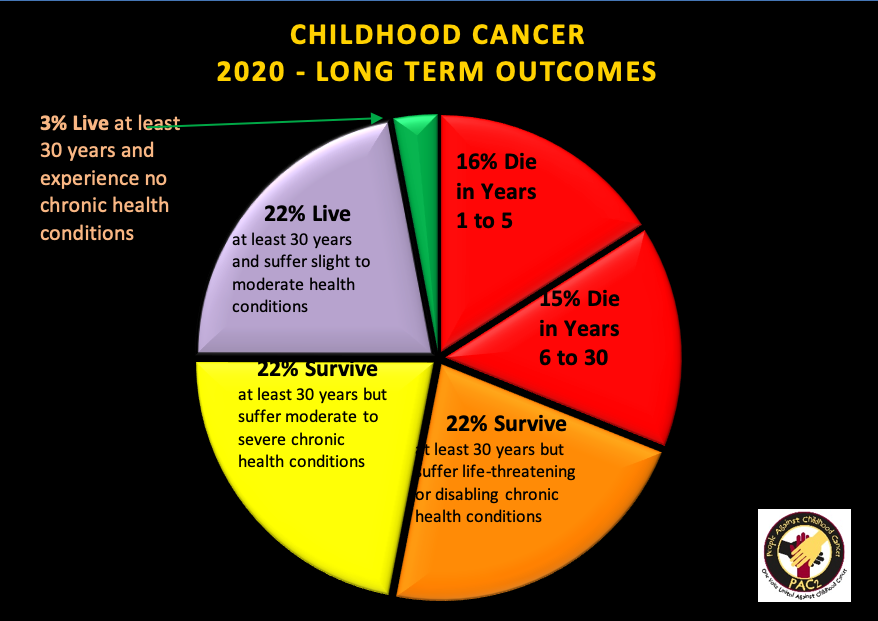
The chart below summarizes the projected outcomes for children diagnosed with cancer.
 In summary:
- Very few kids will live at least 30 years after diagnosis without health conditions
- About 1 in 5 live at least 30 years but face slight to moderate chronic health conditions
- About 1 in 5 live at least 30 years but face moderate to severe chronic health conditions
- About 1 in 5 live at least 30 years but face life-threatening or disabling chronic health conditions
- About 1 in 3 die within 30 years of diagnosis
As far as good news: PAC2 completed a similar evaluation in 2008, and found that 34% of children diagnosed died within 30 years — that number has now decreased to 31%! In addition, over the past decade there has been an increasing emphasis on survivorship and minimizing “damage” from treatments, which we’d expect results in fewer and fewer chronic health conditions. OPINION: Only #1 is acceptable! This exercise was not to take away from the doctors and researchers doing great work for our kids or to discourage anyone. I think it shows the REALITY of childhood cancer. IMHO childhood cancer is misrepresented when we talk about an 85% “cure” rate. And, I think that misrepresentation diminishes the perceived need for better treatments, which can then lead to truly tragic consequences when it comes to funding more research; which is the only way we’ll finally fix this tragedy of childhood cancer. I’d like to acknowledge the excellent CAC2 Fact Library and all those who helped compile the data. Thanks to all reviewers and to CAC2 for the opportunity to share. Projections are based solely on PAC2’s evaluation of the data sets, and actual results will vary. Please excuse all rounding errors. Go kids! References
- Mark Twain – “There are three kinds of lies: lies, damned lies and statistics.”
- American Cancer Society, A Journal for Clinicians, Cancer Statistics 2020, Table 12: Case Distribution (2012 Through 2016) and 5-Year Relative Survival (2009 Through 2015) a by Age and ICCC Type, Ages Birth to 19 Years, United States. https://acsjournals.onlinelibrary.wiley.com/doi/abs/10.3322/caac.21590
- Journal of the National Cancer Institute “Cause-Specific Late Mortality Among 5 Year Survivors” http://jnci.oxfordjournals.org/content/100/19/1368.full
- Jude Children’s Research Hospital, (JAMA. 2013:309 [22]: 2371-2381) http://jama.jamanetwork.com/article.aspx?articleid=1696100


